Return to IELTS Writing Start Page
Model Answer, Cambridge Practice IELTS Tests, Book 8, Test 1, Task 1
###############################################################################################################
Notes
For example, in North America in the 1990s, 0.2% of the total land area was degraded by deforestation and 5% of the total land area was degraded by all causes. Therefore, the percentage of degraded land due to deforestation was 0.2/5.0 = 4%. Now we can compare that to the world average of 30% of degraded land caused by deforestation. We have a saying in English: "You can compare oranges with oranges, but you can't compare oranges with apples" (or something like that).
The Quick Mental Calculations That You Need to Do to Re-Interpret the Data in the Table in Order to Compare the Table Data with the Pie Chart Data
N. America
Europe
Oceania
World Average
Deforestation %
0.2/5.0 = 4%
Much less than the world average
9.8/23 =
42%
A bit more than the world average
1.7/13 =
13%
Less than half the world average
30%
Over-cultivation %
3.3/5.0 =
70%
More than double the world average
7.7/23 = 34%
About the same as the world average
0/13 = 0%
Much less than the world average
28%
Over-grazing %
1.5/5.0 = 30%
About the same as the world average
5.5/23 = about 25%
A bit less than the world average
11.3/13 = about 90%
Much more than the world average
35%
###############################################################################################################
The Essay
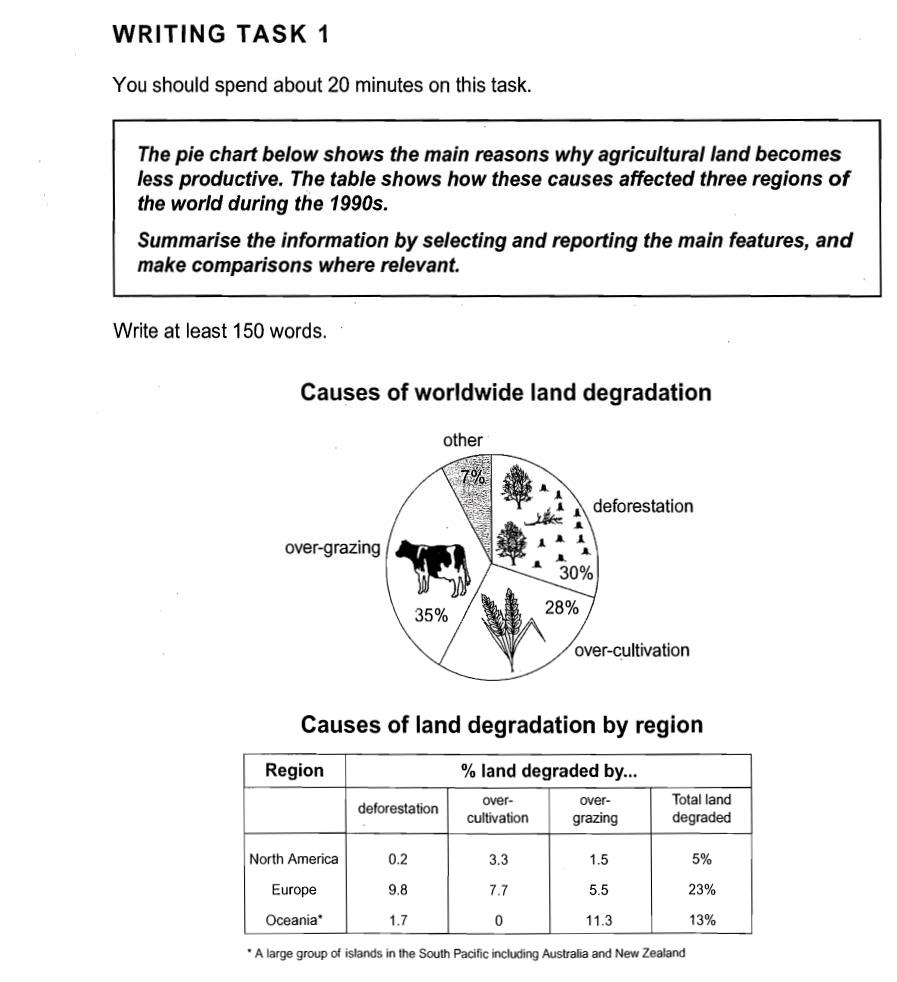
The pie chart shows that there are three main causes of land degradation in the world, i.e., deforestation, over-cultivation and over-grazing, with a worldwide average of about 30% attributable to each. However, as the table shows, there were major variations in the contribution of these factors in at least two major parts of the world in the 1990s.
Specifically, deforestation in North America caused only 4% (0.2/5.0) of degradation, which was much less than the world average, while over-cultivation caused 70% (3.5/5.0), which was double the world average.
Similarly, figures for Oceania showed great variance from the world average, with deforestation causing only about 12% (1.7/13) but over-grazing causing a massive 90% (11.3/13) of land degradation. In great contrast to that, no significant damage at all resulted from over-cultivation in Oceania. Of the three areas quoted, only in Europe did the three causes of degradation approximate the world average of about 30% (plus or minus 15%).
The table also shows that there was considerable variation in the extent of land degradation in the three areas, from 5% of total land area in N. America to 23% in Europe.
###############################################################################################################
Word Count = 188. This is a touch long but, of course, acceptable. I think the last paragraph (the last sentence) could be omitted and the essay would still be worth Band 9 because the main point of the data is the variation from the world averages in two of the three parts of the world. That is why the pie chart exists, to tell us these world averages.
Useful Things To Remember
(The percentages here are approximate)
1/6 = 17% and 1/17 = 6%
1/7 = 14% and 1/14 = 7%
1/8 = 12% and 1/12 = 8%
1/9 = 11% and 1/11 = 9%