Written June 22, 2019
Return to IELTS Writing Start Page
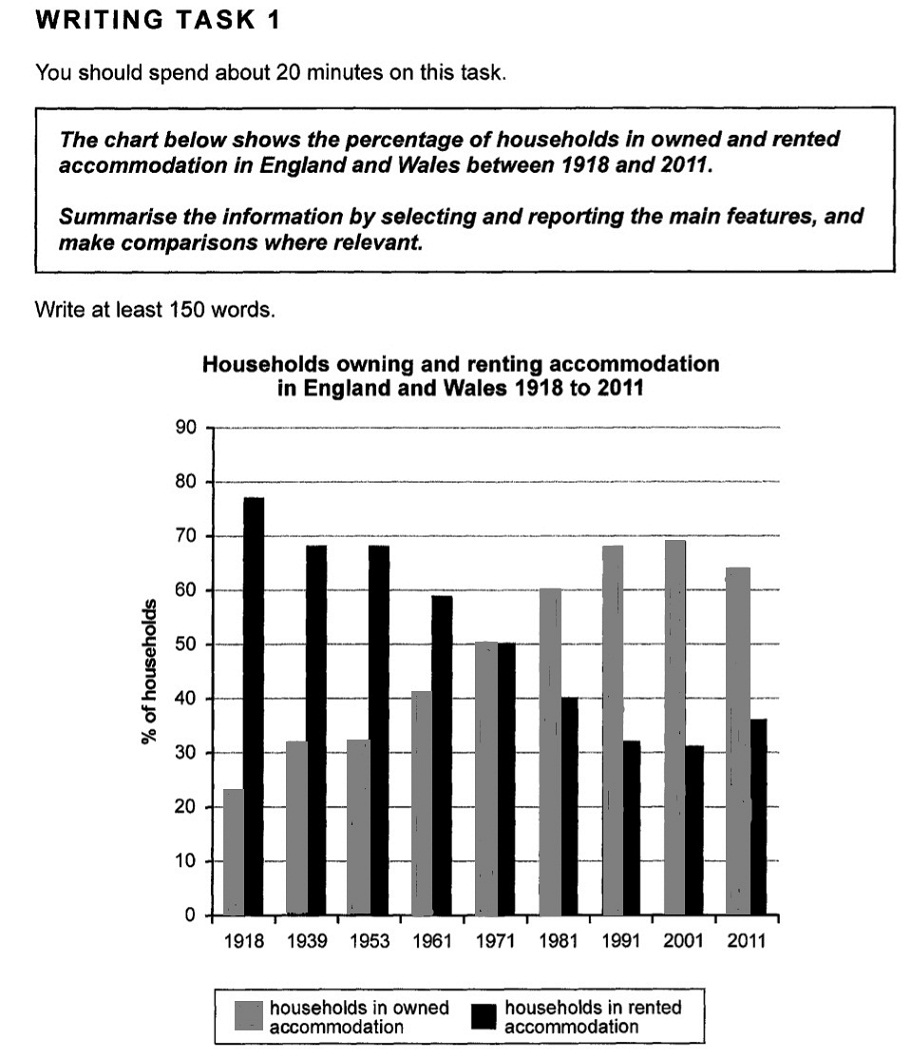
My Model Answer for Test 2, Task 1 in Book 13 of the Cambridge Practice IELTS Tests series
This graph shows an overall increase of home ownership in England and Wales between the years 1918 and 2001, with a corresponding decrease of households living in rental accommodation during those years. However, in contrast to the previous five decades of continuous growth in ownership, this trend started to reverse after 2001.
Between 1918 and 1953, home ownership increased from about 23% to 32%, an average growth rate of almost 3% per year for this 33-year period. Noticeably, the 1939 and 1953 figures for ownership are the same, implying that no significant changes occurred over this 14-year period.
The years between 1953 and 1991 saw ownership maintain steady growth at about 10% per year, more than double the rate in the previous growth period from 1918 to 1939. By 1991, home ownership was at 68% with rental accommodation at 32%, which was almost exactly the reverse of the situation in 1953.
After a decade of only a minor increase between 1991 and 2001, home ownership had reached a peak of 69% in 2001, after which it decreased by 5% in the following decade to 64% in 2011.
(187 words)
Notes
Since the figures for ownership and renting, when added together, always total 100%, there is no need to quote figures or trends for both ownership and rental in any particular year or period. That is, for maximum coherence, the essay should mainly focus on just one way of looking at the data, either the ownership trends, or the rental trends.
Previous pages in the Writing section of this website give you some hints on how to make quick, approximate calculations of percentages. It is not necessary to include as many percentage figures as in this essay but at least one or two of these figures in an essay would definitely impress examiners.
Keep in mind that questions such as this are meant to give IELTS candidates who are scientists, engineers, economists etc. a chance to show the kind of mathematical English that is used by such professionals when describing a graph. This is an attempt to compensate for the fact that most of the IELTS test gives a slight advantage to humanities students. Therefore, if your understanding of such concepts as "the rate of increase" is not strong, you need to read some mathematics textbooks or similar sources of information in order to be able to write an essay such as this at a level above Band 6.5.