Modified Mar. 12, 2014
Return to IELTS Writing Start Page
Model Answer, Cambridge Practice IELTS Tests, Book 6, Test 4, Task 1
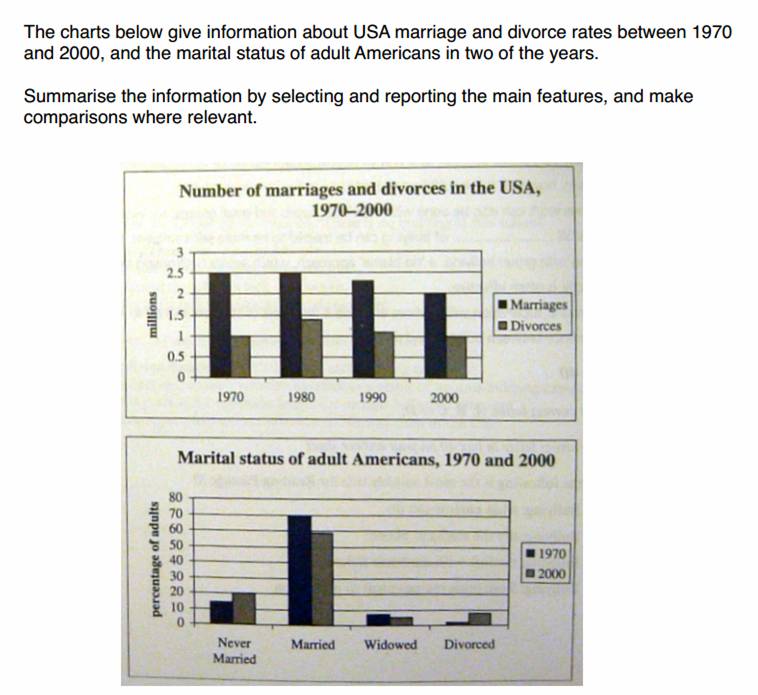
The chart of marital status shows a trend towards an unmarried status for Americans between the years 1970 and 2000, with the percentage of married people in the population decreasing from 70% to about 59% over this period, despite the slight decrease in people of widowed status between these years. The decreased percentage of married people over these three decades mostly reflects the increase in the percentage of never-married adults in the population, as shown in the lower chart, from 14% to 20% over this period, as well as the increase in the percentage of divorced people from about 2% to 9%.
The upper chart shows the progress of this trend, as seen at four equally spaced intervals over this 30-year period. Although the marriage rate remained constant in 1970 and 1980 at 2.5 million per year, divorce numbers increased over this period from 1 to 1.4 million per year. This preponderance of divorces was further compounded in the next two decades by the 0.5 million decrease in the marriage rate, while the divorce rate decreased a smaller 0.4 million.
Word count = 177
++++++++++++++++
Notes
Notice that I wrote, "... an increase in the percentage of divorced people from about 2% to 9%." Was there a 7% increase in divorces? No! Those percentages refer to divorced people (= divorcees), not divorces themselves. For every one divorce, there are two divorced people. The upper chart shows the number of divorces in those years while the lower chart shows divorced people (and it is the same for marriages and married people). Such small differences in your choice of word are important when the examiner considers your accuracy.
Not only are the figures of 2% and 9% not representing divorces, they are also not representing all people in those two years who have been divorced. How is that, you may ask. Well, although this fact is not vital for interpreting the data that has been given and for writing the essay, a very large percentage of married people in the U.S. have been married once or twice before. Many of those married people in that chart had the status of divorced at some previous time. The bottom chart is simply a snapshot of the marital status of the adult population at two points in time.
The missing 6% to 7% of adults could be accounted for by the fact that three categories of people are missing in the lower graph, i) people living in a defacto marriage, ii) people who are separated from their spouse (and possibly going through the divorce process, still not yet divorced but unwilling to identify themselves as "married"), and iii) people who simply refused to answer the question about their marital status. Possibly the type of survey did not allow the respondents to make one or both of the first two of those choices when identifying their marital status. But when writing the essay, you MUST NOT engage in this kind of speculation. You must stick to summarizing the data that is given and do no more.
Besides the category of widowhood in the lower chart, the other three categories in the lower chart can be related to the upper chart and the topic of an unmarried trend. The part that the category of widowhood plays in the total percentages for each year in the lower chart becomes important when totaling those percentages. The observation that the totals in the lower chart are 94% and 93% becomes more than just an incidental observation and is, instead, a rather important, although small observation that should be mentioned in the essay. It's almost like the missing 6% and 7% of people is a trap to see how thorough candidates are in checking the data. Six and seven percent are significant, especially when considered alongside the magnitude of the widowed and divorced statistics in that chart. This indicates that whenever you see percentages listed that should total 100%, it is always a good idea to add them up to see if they do come to 100% or very close to it.