Modified Mar., 2014
Return to IELTS Writing Start Page
Model Answer, Cambridge Practice IELTS Tests, Book 8, Test 4, Task 1
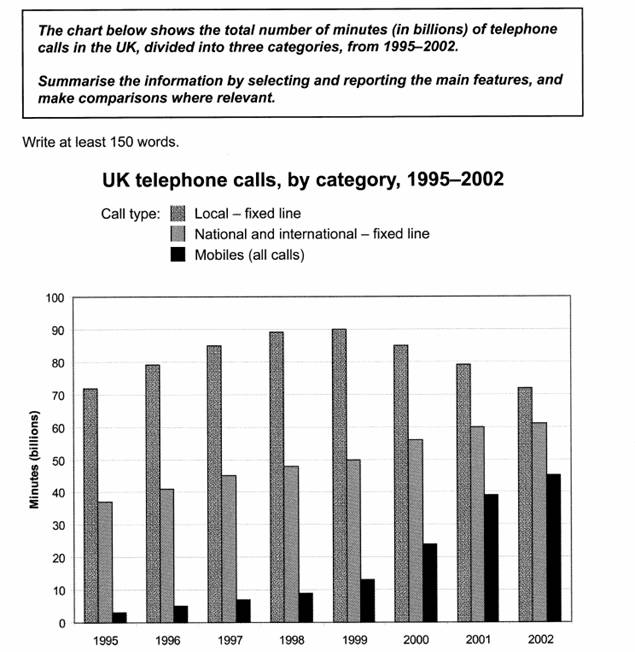
The chart shows an increasing trend for the time spent on both fixed line long-distance calls (i.e., national and international calls) and on all calls made by mobile phones between 1995 and 2002. In contrast, the time spent on fixed line local calls only increased in a similar manner between 1995 and 1998-9, when it reached a peak of 90 billion minutes (bm) per year, after which it declined steadily to 72 bm/yr in 2002.
Noticeably, the beginning of this decline in fixed line local call usage in 1999 was also the beginning of a dramatic increase in the rate of growth of mobile phone calls. Before 1999, mobile usage had been increasing at a moderate growth rate of 2 bm/yr. However, the period 1999 to 2002 saw usage grow rapidly from 13 bm/yr to 45 bm/yr, with the result that mobile usage constituted about 25% of all phone usage in 2002, a spectacular increase from the figure of 3% in 1995.
In contrast to fixed line local calls, fixed line long-distance calls maintained continuous growth in usage, from 37 bm to 61 bm, although by 2002, the percentage of all phone time attributed to these calls was virtually unchanged from the 1995 figure of about 34%.
Word count = 207
+++++++++
Notes
"increase in the rate of growth" could also be written as, "acceleration of the rate of growth".
Calculations
In 1995 –> total calls = 72 + 37 + 3 = 112. Mobile phone % = 3/112, just under 3%
In 1998 -> total calls = 89 + 48 + 9 = 146, say 145. Mobile phone % = 9/145, = about 1/16 = about 6%
In 2002 -> total calls = 71 + 61 + 45 = 177, say 175. Mobile phone % = 45/175, = 9/35 = about 9/36 = about 1/4% = about 25%
rate of growth of mobile 1995 to 1998 = growth of 6 over 3 years = 2 per year
rate of growth of mobile 1999 to 2002 = growth of (45-13 =) 32 over 3 years = almost 11 per year
fixed line long-distance calls in 1995 = 37/112% = about 35/110 = about 7/22 = about 1/3 = about 33%
fixed line long-distance calls
in 2002 = 61/177% = about 60/175 = about 12/35 = about 34%